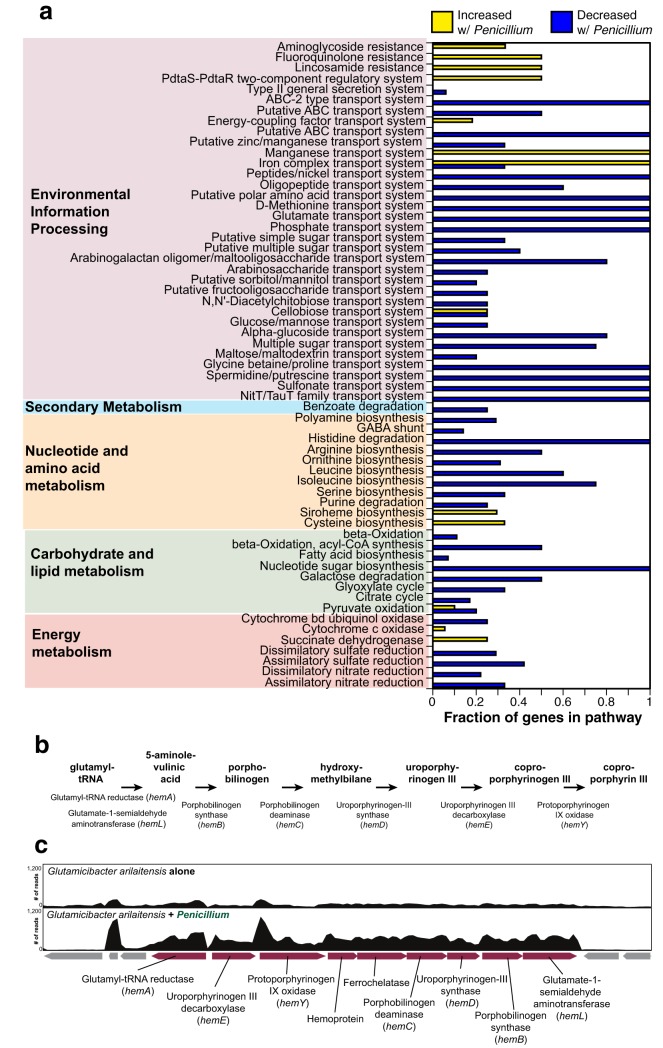
FIG 5 .
RNA-seq of Glutamicibacter arilaitensis alone and cocultured with Penicillium sp. 12. (a) Distribution of differentially expressed genes (greater than 3-fold change in expression) across KEGG pathways. Bars represent the proportions of components in the pathway that are represented in the differentially expressed genes. Yellow bars are genes that increased in expression with Penicillium, and blue bars are genes that decreased in expression with Penicillium. (b) A model of the coproporphyrin III pathway in Actinobacteria, based on reference 41. A detailed model is provided with molecular structures in Fig. S9 in the supplemental material. (c) Organization of the operon in the G. arilaitensis JB182 genome that contains homologs for genes in the coproporphyrin III pathway. The two panels above the operon show the coverage (number of reads mapped) for a representative transcriptome of G. arilaitensis JB182 growing alone (top) and G. arilaitensis JB182 cocultured with Penicillium sp. 12 (bottom).

