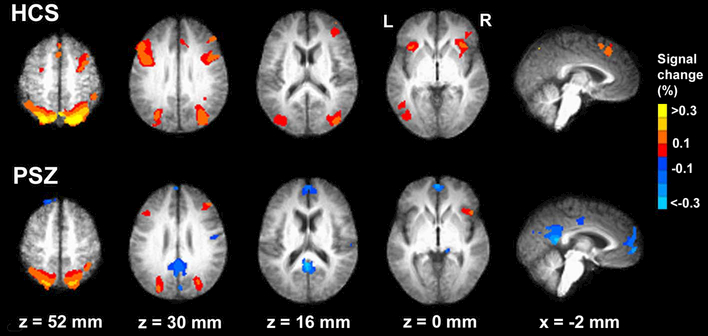
Figure 2: Within-group effects.
Brain regions responding to working memory load in healthy control subjects (HCS) and in participants with schizophrenia (PSZ). Regions displaying increased BOLD signal with larger SS are drawn in warm colors. Region displaying decreased signal with larger SS are drawn in cold colors. Group activation maps are overlaid onto anatomical scans in Talairach space, averaged separately over all 16 HCS, and over all 21 PSZ.

