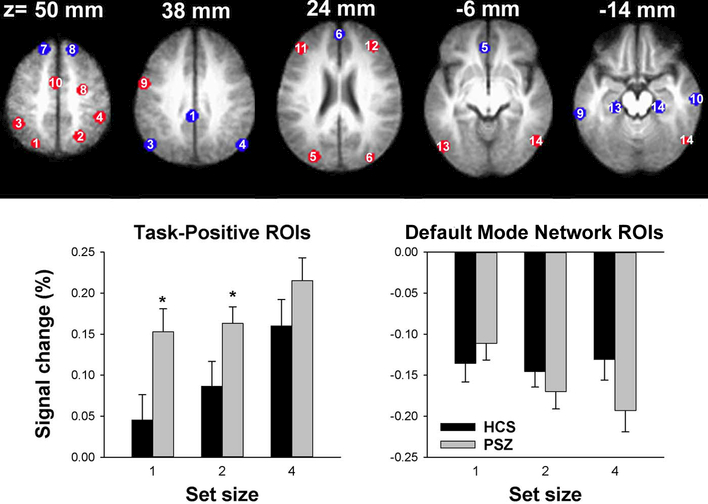
Figure 3: ROI-based group comparison.
7-mm diameter spheres centered on peak foci of the task-positive (red) and default mode (blue) networks identified by Fox et al. (2005), overlaid onto the average of all 37 anatomical scans in Talairach space. The numbering corresponds to ROIs in Table 2. The graphs display average (±SEM) BOLD activity over task-positive and over default mode network ROIs in healthy controls subjects (HCS) and people with schizophrenia (PSZ) for each SS. *P<0.05 in independent-samples t-test.

