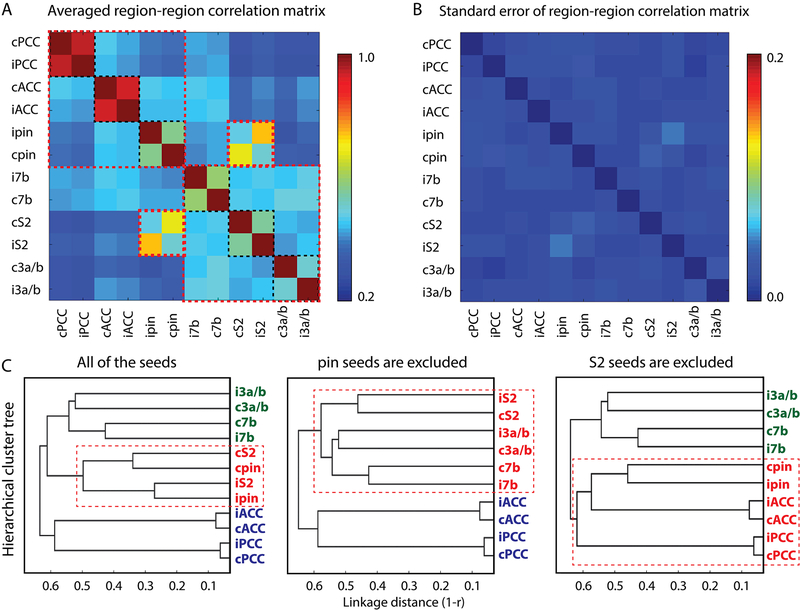
Figure 5.
Connectivity relationships among main regions identified in rsFC maps of nociceptive S2 and pIns region. (A) 2D matrix plot of the group averaged inter-regional correlation strength (r-value, see color bar for range). (B) 2D matrix plot of corresponding standard error in A. (C) Hierarchical cluster tree organization of connectivity strength rankings of all twelve seeds (left), ten seeds excluding ipsilateral and contralateral pIns (middle), and ten seeds excluding S2 ipsilateral and contralateral S2 (right). The x-axis indicates the distance (1-r) used for clustering with a weighted average-linkage algorithm (WPGMA). A total of 15 resting-state fMRI runs from 4 animals were included in the quantification.

