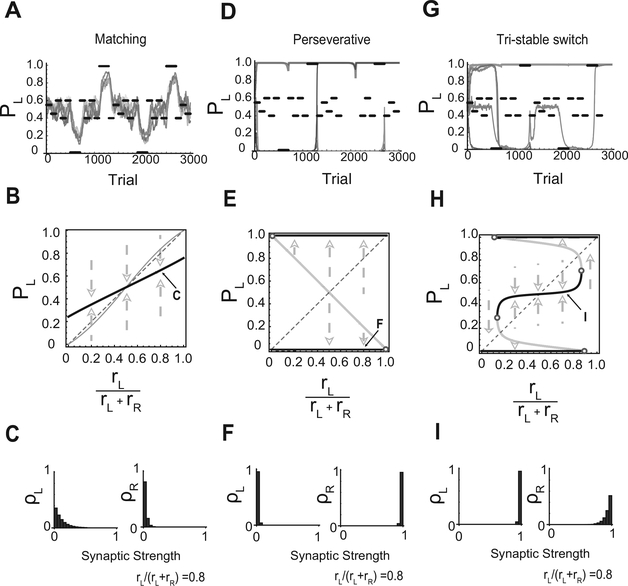
Figure 2:
The three regimes. (A-C) Matching regime. (A) Simulated dynamics of the choice probability PL. The probability of baiting left is set to different values in different blocks of trials (solid black lines). The thick solid line represents PL in different runs of simulations with the same parameters. In this regime, PL tends to follow the changes in the baiting probability. (B) Equilibrium PL versus the fractional baiting probability rL/(rL + rR ). The thick solid line represents the stable equilibrium PL, which in this regime it is approximately linear. The thin solid line represents the matching law. (C) The equilibrium distribution of the synaptic weights to the two-choice populations in the matching regime at the point indicated by C in panel B. (D-F) Same as in panels A-C but for the perseverative regime. (D) Now the simulated network tends to always choose the same target regardless the baiting probability. The chosen target depends on the initial conditions. Occasionally, for strongly biased baiting probabilities, the network switches target (see the vertical lines). (E) Now there are two stable equilibrium values for PL (top and bottom solid horizontal lines). The thin solid line in the middle represents unstable fixed points of PL and separates the two basins of attractions. (F) The distributions of the synapses are now skewed in opposite directions for the two populations of synapses. (G-I) Same as in panels A-C but for the tristable regime. (G) PL is most of the time close to one of the three stable points (0, 0.5, 1). (H) For an extended range around a fractional baiting probability of 0.5, there are three stable and two unstable points. (I) The distribution of the synapses for the stable point around PL = 0.5. The distributions for the other two stable points are similar to those of the perseverative regime. Parameters: (A) m = 2, T = 0.1, , γ = 1, rR + rL = 0.35; (B) m = 50, T = 0.1, , γ = 0.1, rR + rL = 1; (C) m = 50, T = 0.1, , γ = 1, rR + rL = 1.

