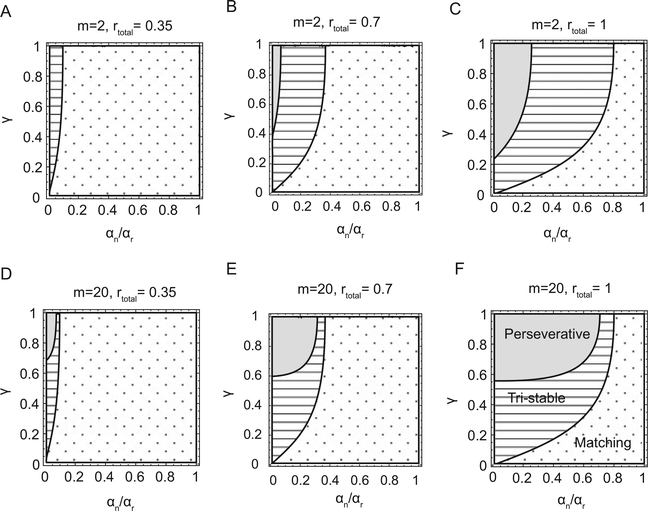
Figure 3:
How the parameters of the neural circuit and the experimental protocol determine the behavioral regime. Each plot shows for what values of αn/αr (x-axis) and γ (y-axis) the network exhibits the three behavioral regimes (gray region = perseverative; striped = tristable; dotted = matching). Different plots correspond to different values of the number of synaptic states m and the overall reward affluence rtotal = rL + rR. The behavior of the network is shown for rtotal = 0.35 (A, D). The value used in experiments in which the matching behavior is observed (Sugrue et al., 2004; Corrado et al., 2005). As rtotal increases, the region with the matching behavior gradually shrinks. (B, E) rtotal = 0.7. (C, F) rtotal = 1. Notice that the border separating the striped from the dotted region does not depend on m.

