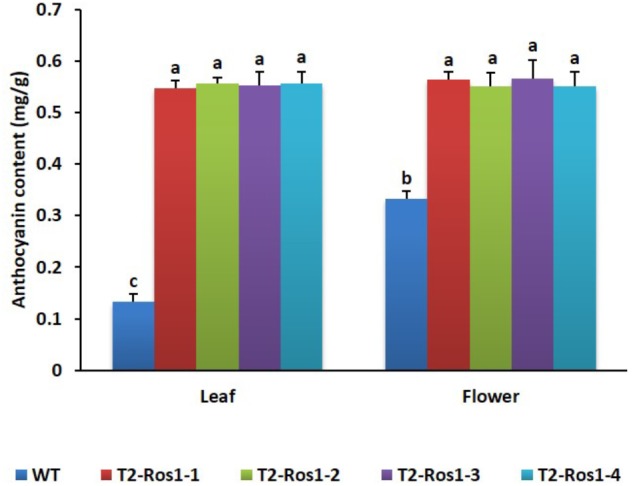
FIGURE 2.

Comparative analysis of anthocyanin content in leaves and flowers of WT and four independent T2-Ros1 lines. Error bars indicate the standard errors (SE) of means of three replicates. Means with different letters are significantly different (DMRT, p < 0.05).
