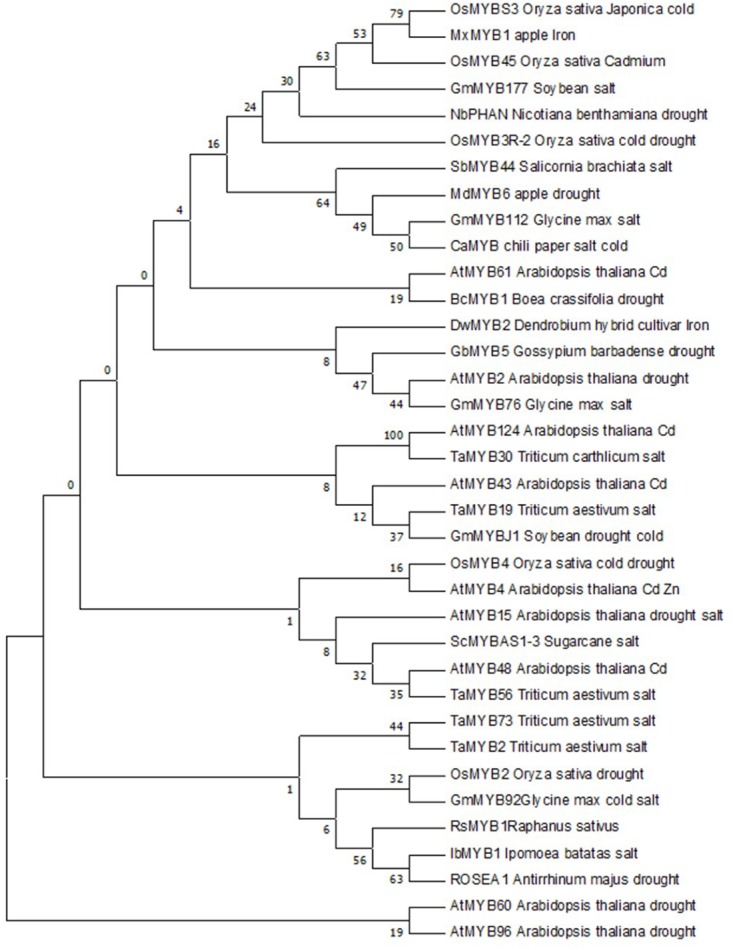
FIGURE 5.

Phylogenetic relationships of the Ros1 MYB with other 35 MYBs that confer different abiotic stress tolerances. The evolutionary history was inferred using the Maximum Parsimony method. Tree #1 out of 3 most parsimonious trees (length = 943) is shown. The consistency index is (0.538298), the retention index is (0.371014), and the composite index is 0.200261 (0.199716) for all sites and parsimony-informative sites (in parentheses). The percentage of replicate trees in which the associated taxa clustered together in the bootstrap test (1500 replicates) are shown next to the branches (Felsenstein, 1985). The MP tree was obtained using the Subtree-Pruning-Regrafting (SPR) algorithm [pg. 126 in ref. (Nei and Kumar, 2000)] with search level 1 in which the initial trees were obtained by the random addition of sequences (10 replicates). The analysis involved 35 amino acid sequences. All positions containing gaps and missing data were eliminated. There were a total of 59 positions in the final dataset. Evolutionary analyses were conducted in MEGA7 (Kumar et al., 2016).
