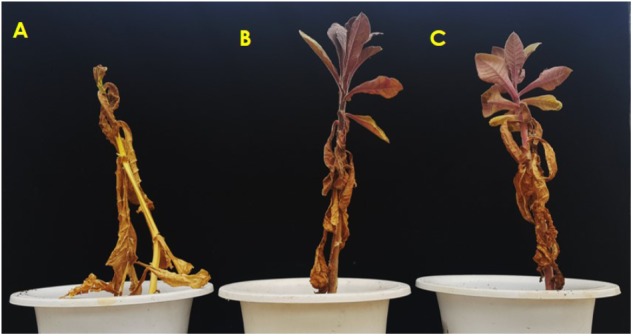
FIGURE 8.

Comparison of the tolerance of the drought stress in WT (A) and independent T2-Ros1 lines (B,C) under drought stress. Induction of drought stress was observed in the plants after 20 days of the drought stress, and the plants were not watered for 30 days. Following the stress, the plants were regularly re-watered, and the photos were taken 10 days after re-watering.
