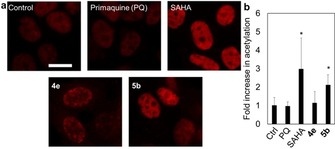
Figure 3.

MCF‐7 cells were treated with PQ, SAHA, 4 e, or 5 b (1 μm) for 24 h. a) Representative fluorescence micrographs of MCF‐7 histone H3 acetylation (red) at lysine 9/lysine 14 in response to treatments. Cells were incubated with primary antibody (rabbit anti‐acetyl‐Histone‐H3 polyclonal antibody, 500× dilution) for 24 h and then with secondary antibody (Alexa Fluor 647 goat anti‐rabbit IgG −2 mg mL−1; 500× dilution) for 1 h in the dark. Cells were imaged by using a fluorescence microscope with a CY5 filter. Fluorescence was analyzed in ImageJ. Scale bar represents 20 μm. b) Averages of fluorescence per cell±SD (as fold increase in untreated control=1) from at least two independent experiments. * p<0.05, t‐test.
