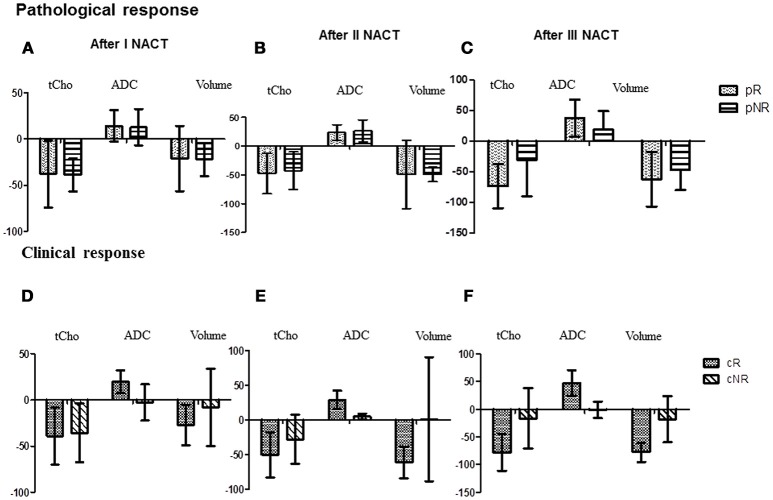
Figure 2.
The bar diagram showing the percentage changes in three MR parameters (tCho, ADC and volume) in pathological responders and non-responder after I (A), II (B), and III NACT (C) compared to the pre-therapy value. While (D–F) show percentage changes in these parameters in clinical responder and non-responder patients.

