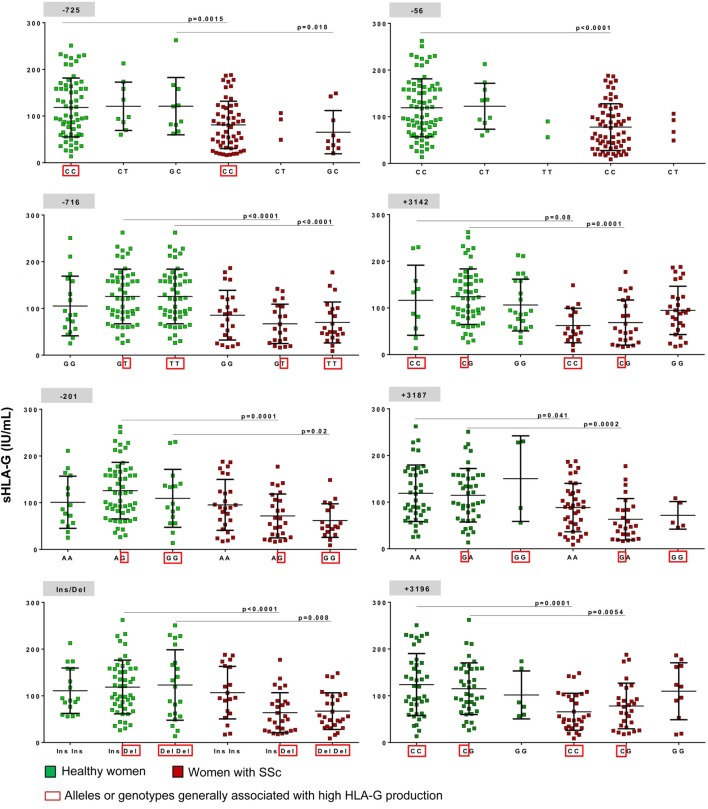
Figure 3.
Concentration of soluble HLA-G (sHLA-G) per mL of plasma according to different human leukocyte antigen (HLA)-G genotypes. The eight polymorphisms tested (−725, −716, −201, −56, Ins/Del, +3,142, +3,187, and +3,196) are represented with their three possible genotypes (i.e., GG, GT, and TT for −716 SNP) except for −725 SNP for which six genotypes exist: CC, CT, GC, TT, GG, and GT but the last three were not represented on the graph as only few women had these genotypes; sHLA-G concentration values are represented for each genotypes in green (on the left side) for healthy women and in red (on the right side) for women with SSc. A red square is surrounding alleles or genotypes having been described in most studies with high HLA-G production. Means and SDs are given for each scatter plot by black bars. P values are calculated by Mann–Whitney tests.

