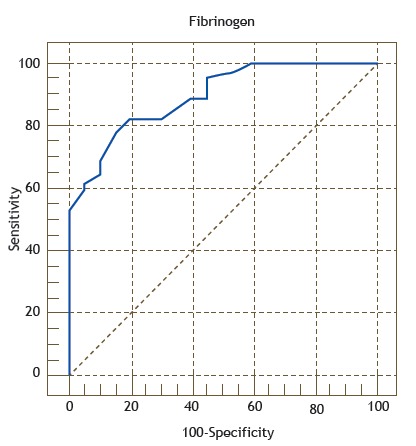
Figure 4. ROC curve of the accuracy of fibrinogen in identifying acute exacerbation of COPD, with an area under the curve of 0.89 (p < 0.005). The curve was constructed by calculating the sensitivity versus the specificity for the different possible fibrinogen cut-off points.