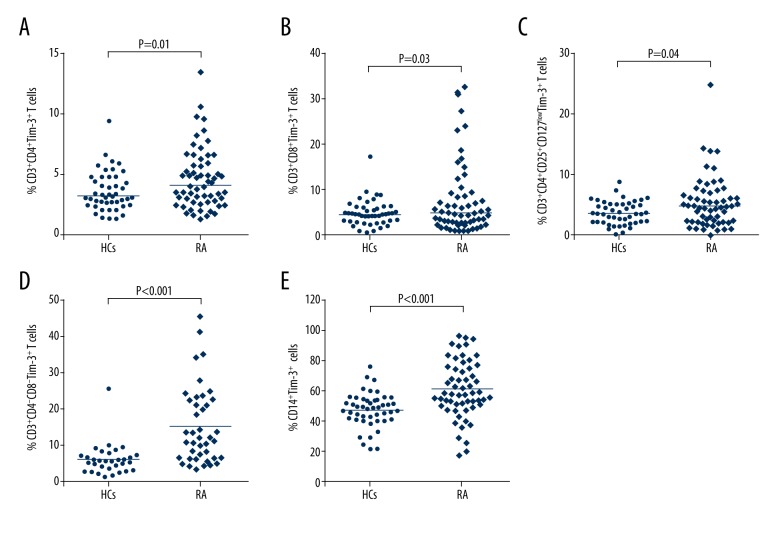
Figure 4.
TIM-3 expressions on different T cell subsets and monocyte in RA patients. (A) Proportions of CD3+CD4+TIM-3+ T cells in RA compared to HCs. (B) Proportions of CD3+CD8+TIM-3+ T cells in RA patients compared to HCs. (C) Proportions of CD3+CD4+CD25+ CD127lowTIM-3+ T cells in RA patients compared to HCs. (D) Proportions of CD3+CD4−CD8− TIM-3+ T cells in RA patients compared to HCs. (E) Proportions of CD14+TIM-3+ cells in RA patients compared to HCs. The horizontal indicates the median values of the different groups. The differences between the 2 groups were analyzed by Mann-Whitney U test. A value of p<0.05 was considered to be statistically significant.

