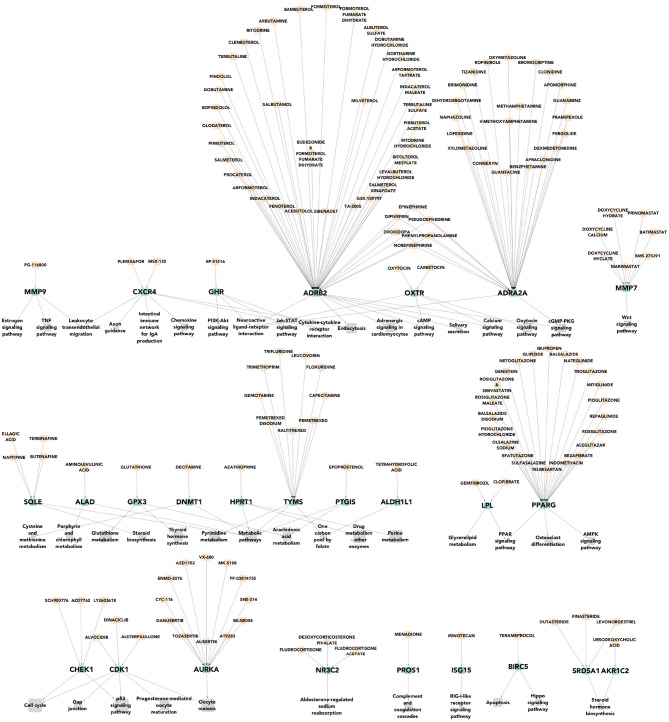
Figure 4.
Pharmacological targets of the most deregulated pathways for basal breast cancer subtype. In gray the most deregulated molecular pathways by PDS are shown. In green color, we represent the differentially expressed pharmacological targets that had a drug which lead to homeostasis. Finally, in apricot color we show the drugs that affect expression of such pharmacological targets. We can observe that there are many more pharmacological targets associated to this specific tumoral subtype than those currently used for their clinical treatment.

