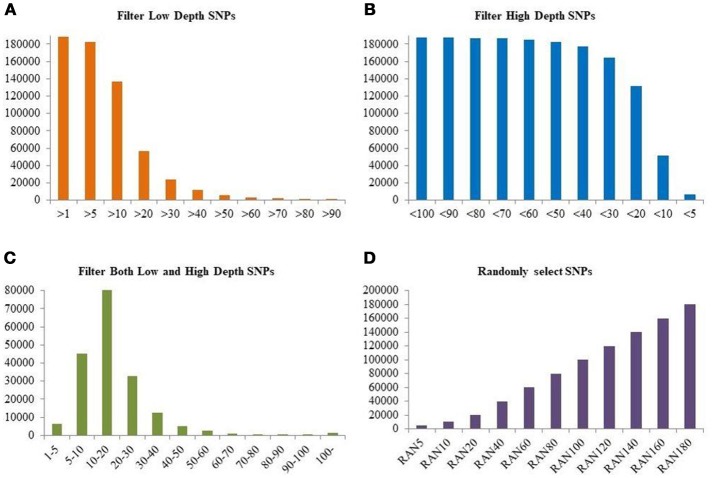
Figure 2.
Numbers of SNPs retained for four different filtering strategies. (A) Number of SNPs in each FILTLOW dataset with different lower threshold; (B) Number of SNPs in each FILTHIGH dataset with different upper threshold; (C) Number of SNPs in each FILTBOTH dataset with different lower and upper thresholds; (D) Number of SNPs in each RAN dataset with different size. The y-axis is the number of SNPs after filtering. In (A–C), the x-axis is different subsets of SNPs with various sequencing depth, and the x-axis in (D) is randomly selected subset with different size.

