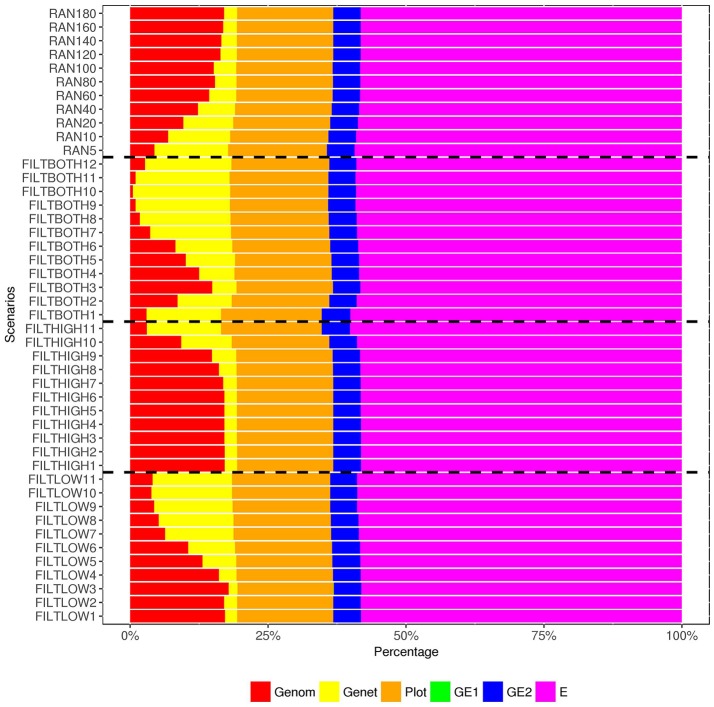
Figure 6.
Percentage of variance components1, 2 over the total phenotypic variance for dry matter yield. 1
 Genom, Additive genomic variance;
  Gene, Residual genetic variance;
  PLOT, random plot variance;
  GE1, family × sowing year × location × management variance;
  GE2, family × sowing year × location × management × farming year variance;
  E, residual environment variance. 2 GE1 is too small to be visible, so that there are only five variances can be observed in this figure.

