
Figure 2.
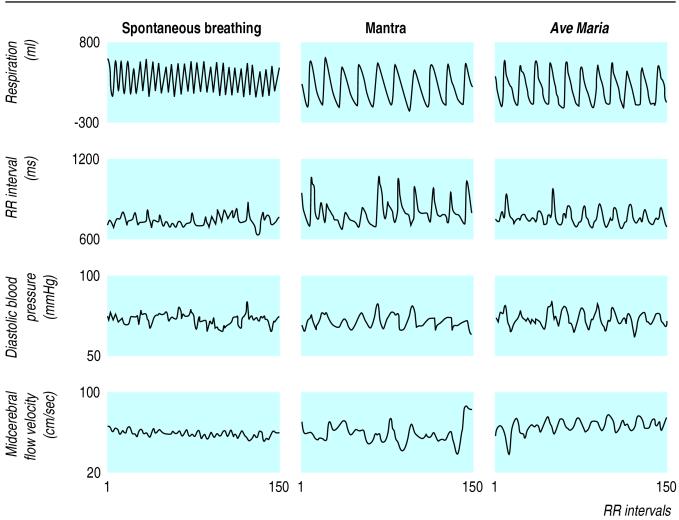
Power spectrums of respiration and cardiovascular signals during spontaneous breathing, free talking, and recitation of the Ave Maria. Note the left shift of the spectrums during vocal sequences, due to slower breathing. Rhythmic recitation (regular oscillations) gives narrower spectral peaks; free talking (irregular oscillations) produces broader peaks