Figure 5.

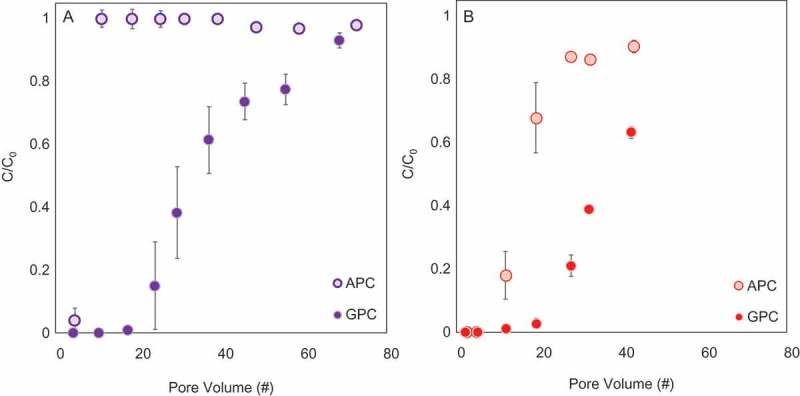
Filtration of (a) selenate (0.2 mM) or (b) eosin-Y (0.1 mM) through columns of APC or GPC (mixed with sand) presented as emerging pollutant concentrations (C/Co) as a function of the number of column pore volumes.

Filtration of (a) selenate (0.2 mM) or (b) eosin-Y (0.1 mM) through columns of APC or GPC (mixed with sand) presented as emerging pollutant concentrations (C/Co) as a function of the number of column pore volumes.