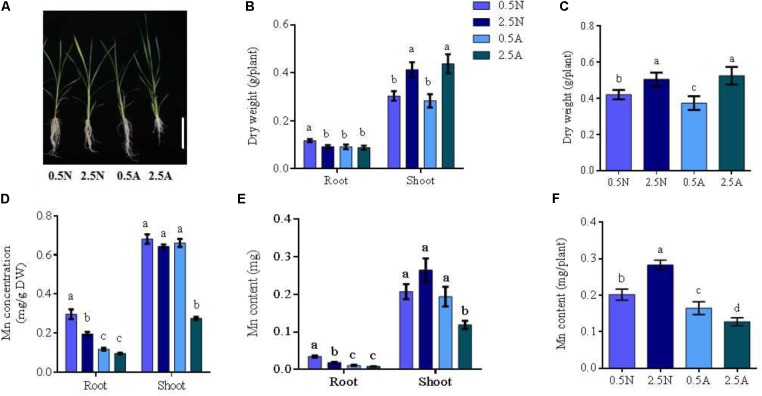
FIGURE 1.
Absorption of Mn elements under different N treatments; (A) the phenotype of wild type (WT) rice in different N treatments; (B) Root and shoot dry weight; (C) the dry weight of whole rice plants; (D) Mn concentrations; (E) Mn content in roots or shoots; (F) the Mn content in the whole plant. DW, dry weight; 0.5/2.5N: 0.5/2.5 mM NO3- as a nitrogen source; 0.5/2.5A: 0.5 mM/2.5 mM NH4+ as a nitrogen source (n = 4 plants). Different letters indicate a significant difference between N treatments (P < 0.05, one-way ANOVA). Bars = 3 cm.

