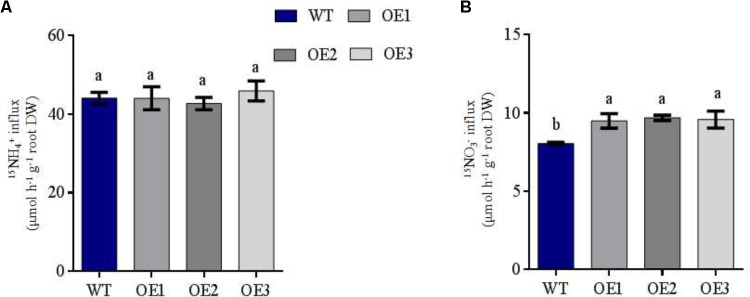
FIGURE 3.
NH4+ and NO3- influx rates of WT and transgenic plants measured using 15N-enriched sources. WT and transgenic rice seedlings were grown in IRRI nutrient solution containing 1 mM NH4+ for 2 weeks and N-starved for 3 days. NO3- and NH4+ influx rates were then measured at (A) 0.5 mM 15NH4+ and (B) 0.5 mM 15NO3- for 5 min. DW: dry weight. Error bars: standard error (n = 4 plants). Significant differences between transgenic and WT lines are indicated by different letters (P < 0.05, one-way ANOVA).

