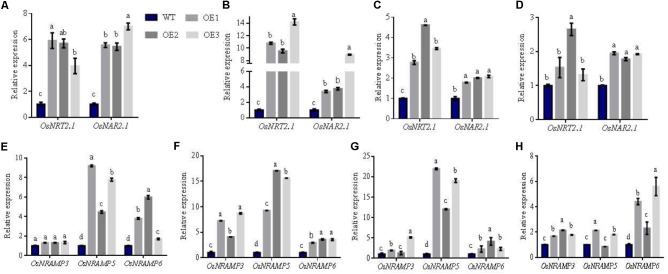
FIGURE 6.
Relative expression of related genes in different arears of WT and transgenic plants in AWD fields. Total RNA was isolated from (A,E) panicle-neck, (B,F) flag leaves, (C,G) flag leaves sheaths, and (D,H) Node I of WT and transgenic lines. Error bars: standard error (n = 4 plants). Different letters indicate a significant difference between WT and overexpression lines (P < 0.05, one-way ANOVA).

