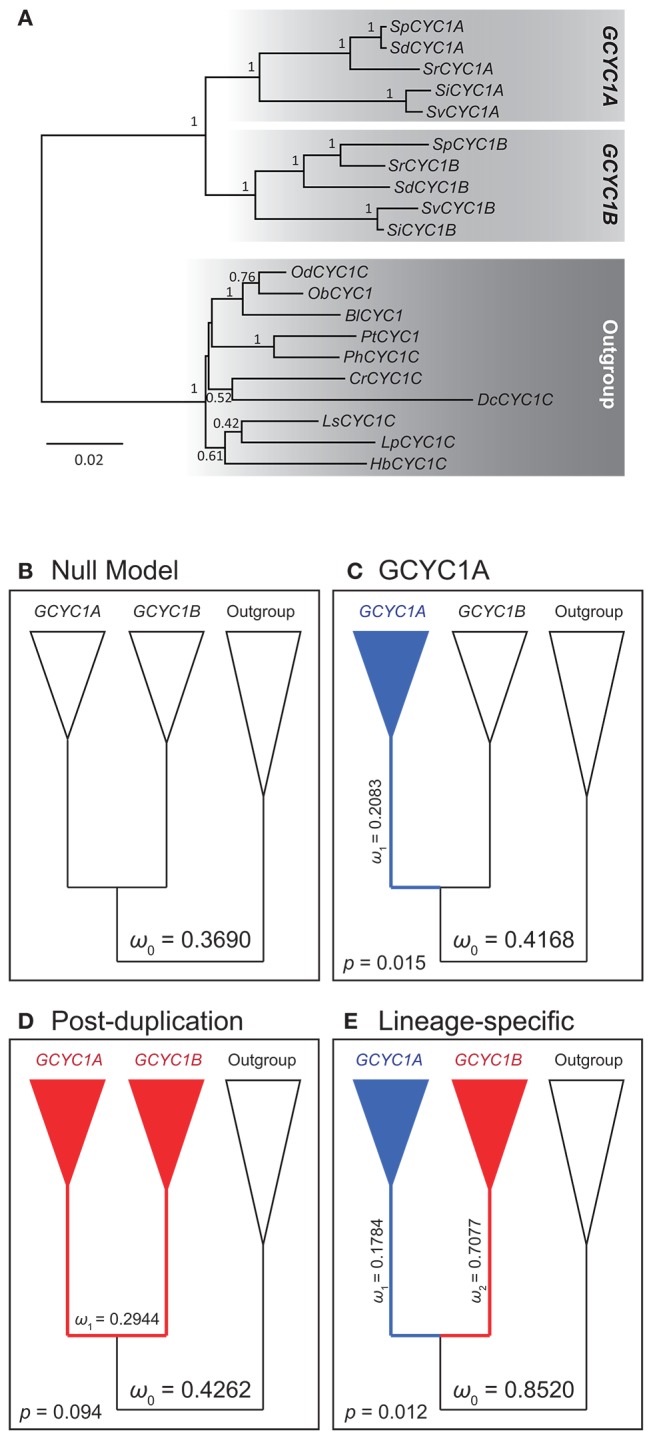
Figure 5.

Phylogeny and Nested models (branch and branch-site) to detect selective constraint shifts between GCYC1A and GCYC1B. (A) Phylogeny of Generiaceae GCYC1 by Bayesian inference was used for inference of molecular evolution by PAML. Posterior probabilities are labeled on the branches (B–E) Evolutionary scenarios of different models; (B) One-ratio null model with constant ω value; (C) Two-ratio model with a distinct selective pressure on GCYC1A; (D) Two-ratio model with a post-duplication alteration of selective pressure; (E) Lineage-specific selective pressures on GCYC1A and GCYC1B lineages estimated from clade model C. The ω value values follow the results in Table 1.
