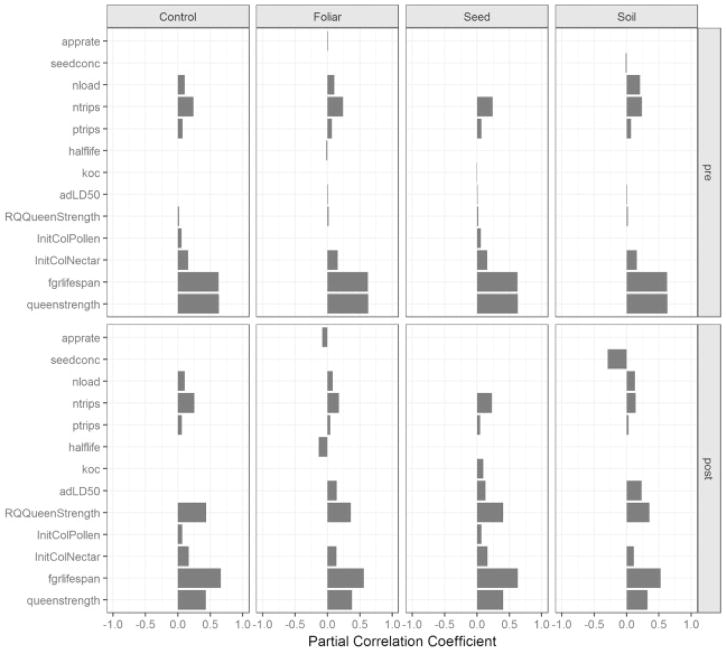
Fig. 6.
Before (top row) and after (bottom row) pesticide application daily sensitivity results. Each column presents PCC results of colony size in four different pesticide conditions (i.e. control, foliar spray, seed, soil). Foliar, seed, soil, and control share similar PCC rankings prior to the pesticide application due to identical base simulation parameters. PCC values and rankings shift with pesticide exposure and differ based on the pesticide application method, though control sensitivities show little change.

