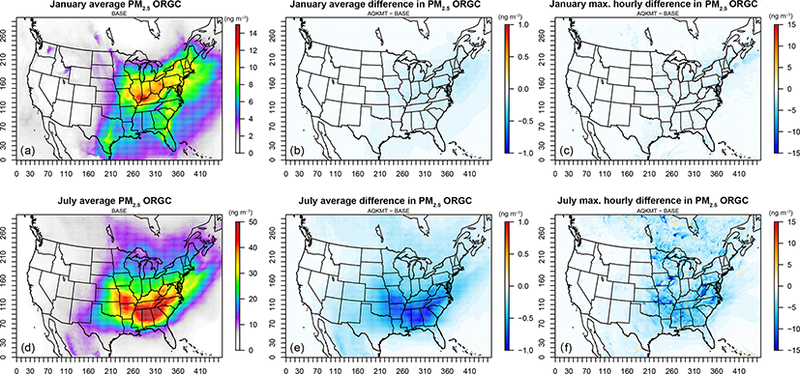
Figure 4.

Average baseline (a, d) and average (b, e) and maximum (c, f) hourly difference (AQKMT−Base) in SOA from cloud processing of carbonyls (ng m−3) for January and July 2011 using CMAQv5.1

Average baseline (a, d) and average (b, e) and maximum (c, f) hourly difference (AQKMT−Base) in SOA from cloud processing of carbonyls (ng m−3) for January and July 2011 using CMAQv5.1