Figure 1.

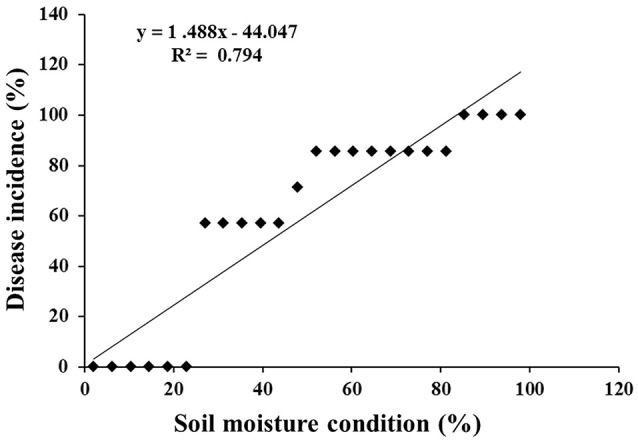
Scatter plot with corresponding regression line and regression equation for the relationship between the dependent variable disease incidence (%) and independent variable soil moisture condition (%).

Scatter plot with corresponding regression line and regression equation for the relationship between the dependent variable disease incidence (%) and independent variable soil moisture condition (%).