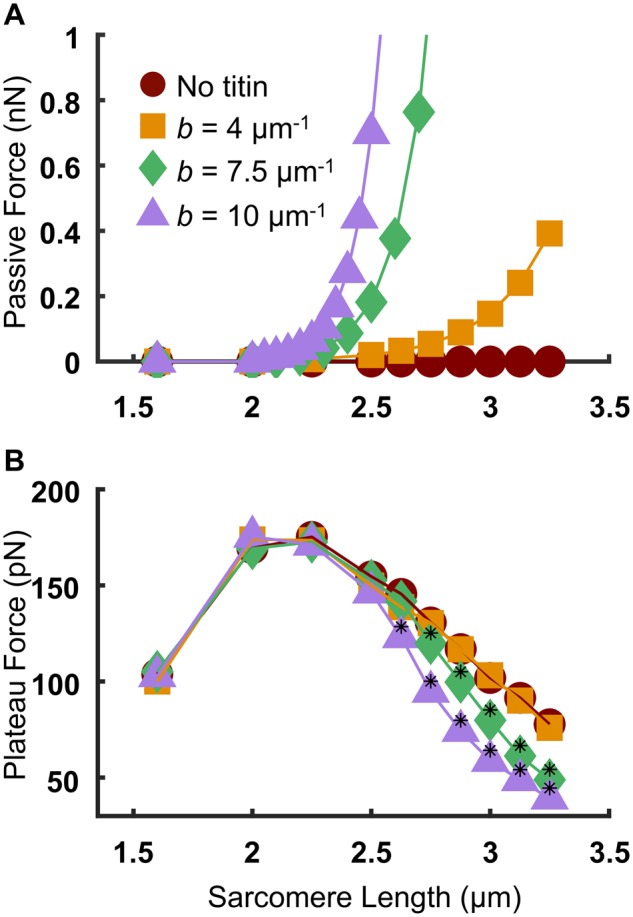
Fig. 2.

Effects of titin stiffness on the passive and active force–SL relations. A) Passive force–SL relation (average of 50 independent runs). B) Active force–SL relation (with the passive component subtracted). Black asterisks indicate a statistically significant difference from both the “no titin” case and the b = 4 μm−1 case (P < 0.05 using a one-way ANOVA with a Tukey’s post hoc test of significance).
