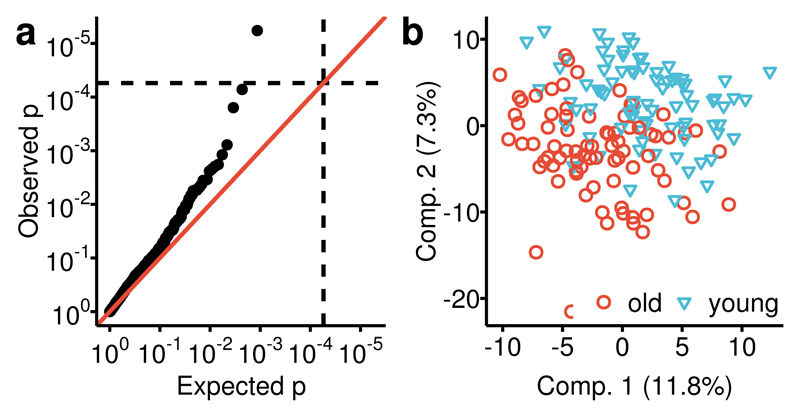
Figure 2. Association of the fecal metabolome with age.
We compared the fecal metabolome between the oldest (>75 yrs., n=79) and youngest decile (<56 yrs., n=80) of the study population. (a) First, we investigated the age effect for all metabolites individually using logistic regression models and found one metabolite, phytanate, significantly different between the youngest and the oldest decile of our data. (b) Then, we fitted a multivariate PLS-DA model to distinguish the older (red) from the younger (blue) group. We estimated the area under the receiver operations curve (AUC) at 0.71 (p=6.8×10⁻⁶) in a 10-fold cross-validation.

