Fig. 6.
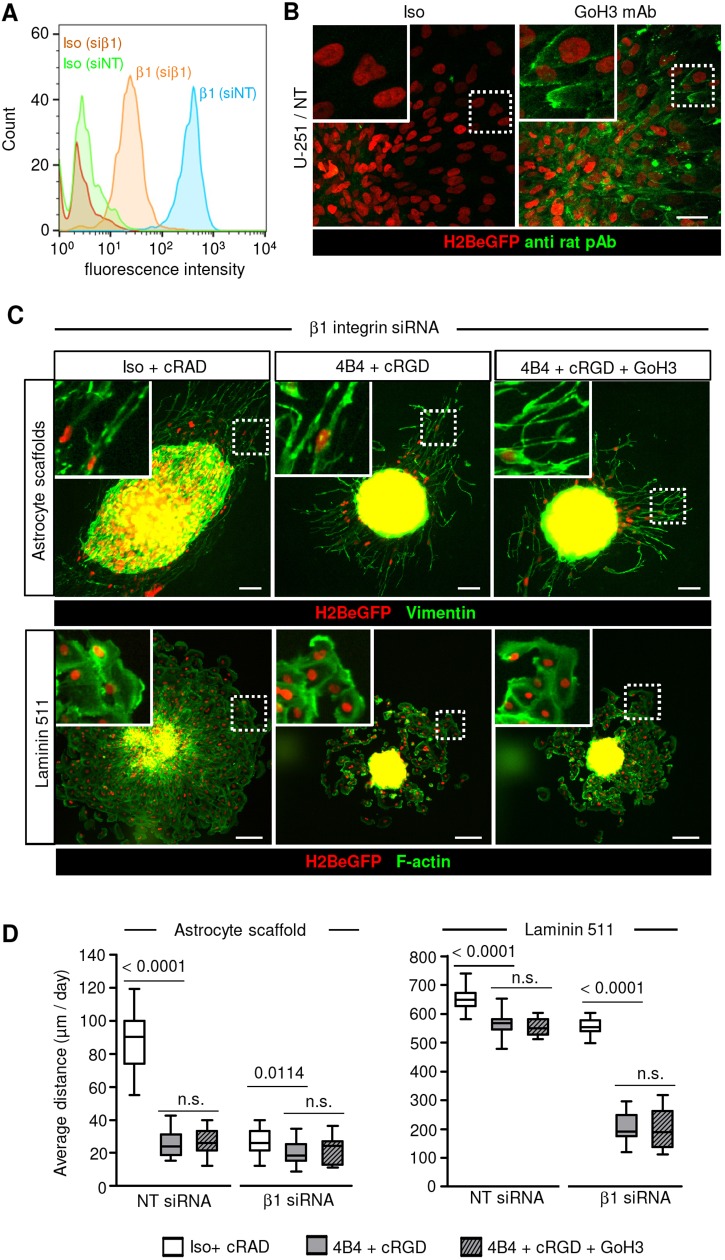
Residual migration of U-251 cells after β1, αV and α6 integrin interference. (A) Surface levels of β1 integrin in U-251 cells 3 days after transfection with either NT or β1 integrin siRNA detected by flow cytometry. (B) Binding of anti-α6-integrin antibody GoH3 but not isotypic IgG2 by migrating U-251 cells in spheroid culture on laminin 511. (C) Migration of U-251 cells from spheroids on laminin 511 (24 h) or in 3D mouse astrocyte scaffold culture (48 h) after multi-targeted interference, as indicated. Glioma cells invading astrocyte scaffolds were identified by human-specific vimentin staining (green) and nuclear H2BeGFP. (D) Average migration distance of U-251 cells on laminin 511 or into 3D astrocyte scaffolds. Data represent 19-33 spheroids per condition in astrocyte scaffolds and 17-20 spheroids per condition on laminin 511 from three independent siRNA transfections. Values display the median (black line), 25th and 75th percentiles (boxes), and maximum and minimum (whiskers). P-values shown were obtained using the Mann-Whitney test. n.s., not significant. Scale bars: 50 µm (B) and 100 µm (C).

