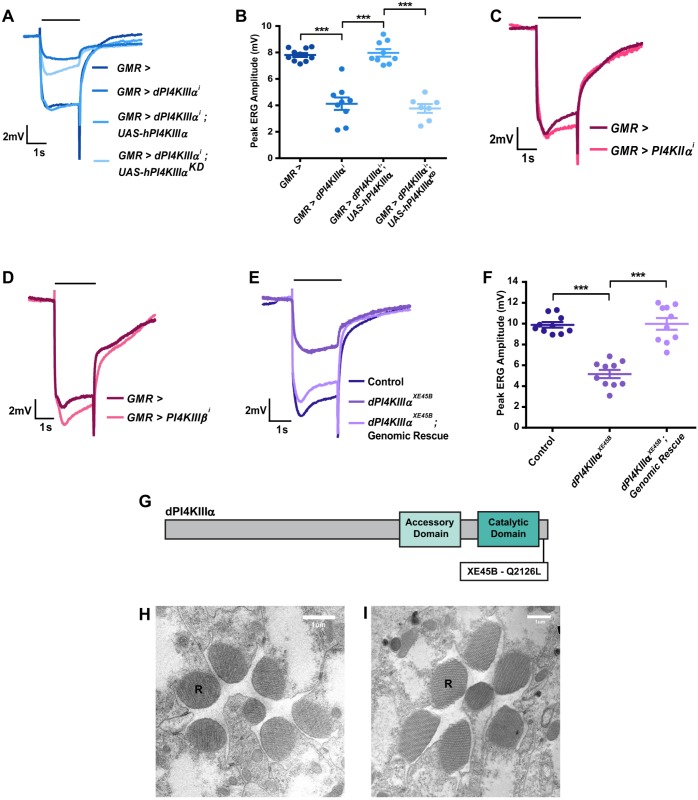
Fig. 1.
PI4KIIIα is required for normal PLC signaling in photoreceptors. (A) Representative ERG trace of 1-day-old flies of the indicated genotype. The x-axis presents time (s); the y-axis is amplitude in mV. The black bar above traces indicates the duration of the light stimulus. The experiment was repeated three times, and one of the trials is shown here. (B) Quantification of the ERG response, where peak ERG amplitude was measured from 1-day-old flies. The x-axis indicates genotype; the y-axis indicates peak amplitude in mV. The mean±s.e.m. is indicated, n=10 flies per genotype. ***P<0.001 (ANOVA followed by Tukey's multiple comparison test). (C–E) Representative ERG trace of 1-day-old flies with genotypes as indicated. The x-axis presents time (s); the y-axis is amplitude in mV. The black bar above traces indicates the duration of the light stimulus. The experiment has been repeated three times, and one of the trials is shown here. (F) Quantification of the ERG response, where peak ERG amplitude was measured from 1-day-old flies. The x-axis indicates genotype; the y-axis indicates peak amplitude in mV. The mean±s.e.m. is indicated, n=10 flies per genotype. ***P<0.001 (ANOVA followed by Tukey's multiple comparison test). (G) Schematic representation of the dPI4KIIIαXE45B point mutation. The location of the Q2126L mutation is indicated. (H,I) Transmission electron micrographs (TEM) showing sections of photoreceptors from 1-day-old control and dPI4KIIIαXE45B mutant flies, respectively. R, rhabdomere.

