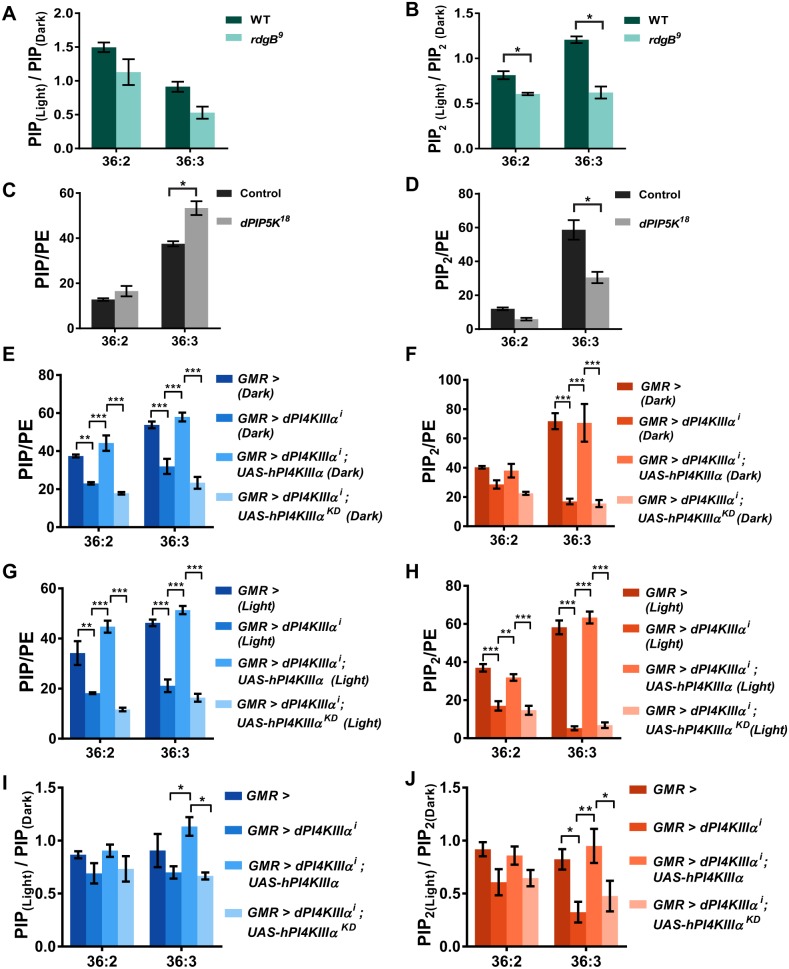
Fig. 2.
PI4KIIIα supports PIP and PIP2 levels during phototransduction. (A,B) Liquid chromatography-mass spectrometry (LC-MS) measurement of total PIP and PIP2 levels, respectively, from retinae of 1-day-old rdgB9 mutant flies. To highlight the effect of illumination on lipid levels, flies were reared in dark and subjected to two treatments – one processed completely in dark (dark) and the other exposed to 1 min of bright illumination before processing (light). The y-axis represents a ratio of lipid levels PIP(light):PIP(dark) and PIP2(light):PIP2(dark),under these two conditions from wild-type (WT) and rdgB9 retinae. Ratios for the two most abundant molecular species of PIP and PIP2 (36:2 and 36:3) are shown. A reduction in the ratio indicates a drop in the levels of PIP and PIP2 during illumination. Values are mean±s.e.m., n=25 retinae per sample *P<0.05 (ANOVA followed by Tukey's multiple comparison test). The experiment was repeated three times, and one of the trials is shown here. (C,D) LC-MS measurement of total PIP and PIP2 levels, respectively, from retinae of 1-day-old dPIP5K18 mutant flies. Flies were reared and processed completely in the dark. Levels for the two most abundant molecular species of PIP and PIP2 (36:2 and 36:3) are shown. The y-axis represents PIP and PIP2 levels normalized to those of phosphatidylethanolamine (PE). Values are mean±s.e.m., n=25 retinae per sample. *P<0.05 (ANOVA followed by Tukey's multiple comparison test). The experiment has been repeated two times, and one of the trials is shown here. (E,F) LC-MS measurement of total PIP and PIP2 levels, respectively, from retinae of 1-day-old flies with genotypes as indicated. Flies were reared and processed completely in the dark. Levels for the two most abundant molecular species of PIP and PIP2 (36:2 and 36:3) are shown. The y-axis represents PIP and PIP2 levels normalized to PE. Values are mean±s.e.m., n=25 retinae per sample. ***P<0.001 (ANOVA followed by Tukey's multiple comparison test). The experiment has been repeated two times, and one of the trials is shown here. (G,H) LC-MS measurement of total PIP and PIP2 levels, respectively, from retinae of 1-day-old flies with genotypes as indicated. Flies were reared in dark and exposed to one minute of bright illumination before processing. The y-axis represents PIP and PIP2 levels normalized to PE. Levels for the two most abundant molecular species of PIP and PIP2 (36:2 and 36:3) are shown. Values are mean±s.e.m., n=25 retinae per sample. ***P<0.001 (ANOVA followed by Tukey's multiple comparison test). The experiment has been repeated two times, and one of the trials is shown here. (I,J) LC-MS measurement of total PIP and PIP2 levels, respectively, from retinae of 1-day-old flies with genotypes as indicated. The y-axis represents a ratio of lipid levels PIP(light):PIP(dark) and PIP2(light):PIP2(dark). Ratios for the two most abundant molecular species of PIP and PIP2 (36:2 and 36:3) are shown. A reduction in the ratio indicates a drop in the levels of PIP and PIP2. Values are mean±s.e.m., n=25 retinae per sample. *P<0.05, **P<0.01 (ANOVA followed by Tukey's multiple comparison test).

