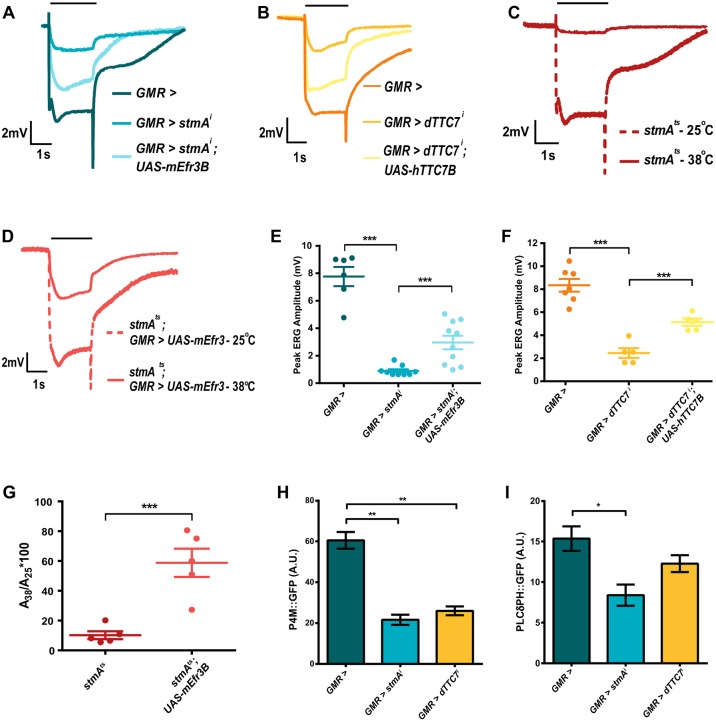
Fig. 4.
Depletion of EFR3 and TTC7 phenocopy the effect of PI4KIIIα depletion in photoreceptors. (A–D) Representative ERG trace of 1-day-old flies with genotype as indicated. The x-axis shows time (s); the y-axis is amplitude in mV. The black bar above traces indicates the duration of the light stimulus. The experiment has been repeated three times, and one of the trials is shown here. (E,F) Quantification of the ERG response, where peak ERG amplitude was measured from 1-day-old flies. The x-axis indicates the genotype; the y-axis indicates peak amplitude in mV. The mean±s.e.m. is indicated, n=10 flies (E) and 5 flies (F) per genotype. ***P<0.001 (two-tailed unpaired t-test). (G) Quantification of the ERG response, where ratio of peak amplitudes at restrictive (38°C) and permissive (25°C) temperatures were taken. The x-axis indicates the genotype; the y-axis indicates ratio of peak amplitudes. The mean±s.e.m. is indicated, n=5 flies per genotype. ***P<0.001 (two-tailed unpaired t-test). (H,I) Quantification of fluorescence intensity of the deep pseudopupil. The fluorescence intensity per unit area is shown on the y-axis; the x-axis indicates genotype. Values are mean±s.e.m., n=10 flies per genotype. *P<0.05; **P<0.01 (two-tailed unpaired t-test). The experiment has been repeated two times, and one of the trials is shown here.

