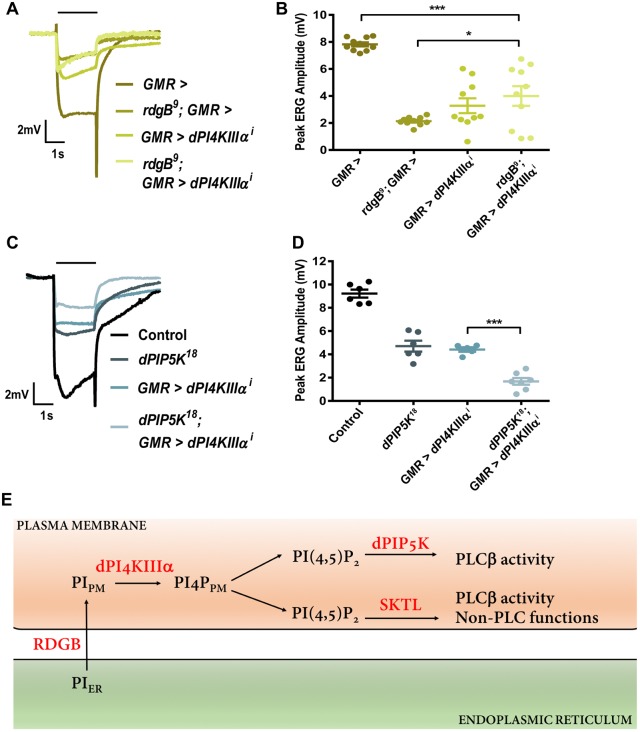
Fig. 7.
Interaction of PI4KIIIα with other components of the PI(4,5)P2 resynthesis pathway. (A) Representative ERG trace of 1-day-old flies with genotype as indicated. The x-axis is time (s); the y-axis is amplitude in mV. The black bar above traces indicates the duration of the light stimulus. The experiment was repeated two times, and one of the trials is shown here. (B) Quantification of the ERG response, where peak ERG amplitude was measured from 1-day-old flies. The x-axis is time (s); the y-axis is amplitude in mV. The mean±s.e.m. is indicated, n=10 flies per genotype. *P<0.05; ***P<0.001 (ANOVA followed by Tukey's multiple comparison test). (C) Representative ERG trace of 1-day-old flies with genotype as indicated. The x-axis is time (s); the y-axis is amplitude in mV. The black bar above traces indicates the duration of the light stimulus. (D) Quantification of the ERG response, where peak ERG amplitude was measured from 1-day-old flies. The x-axis is time (s); the y-axis is amplitude in mV. The mean±s.e.m. is indicated, n=5 flies per genotype. ***P<0.001 (ANOVA followed by Tukey's multiple comparison test). (E) Model of the biochemical reactions involved in the resynthesis of PI(4,5)P2 in Drosophila photoreceptors. Protein and lipid components are depicted according to the compartment in which they are distributed; the plasma membrane and endoplasmic reticulum are shown. PIER indicates PI in the endoplasmic reticulum, and PIPM indicates PI at the plasma membrane. PI4PPM indicates the plasma membrane pool of PI4P generated by PI4KIIIα. The reactions catalyzed by PI4KIIIα, SKTL and PIP5K at the plasma membrane are indicated. PLCβ activity and non-PLC functions are indicated against the pools of PI(4,5)P2 that support these functions.

