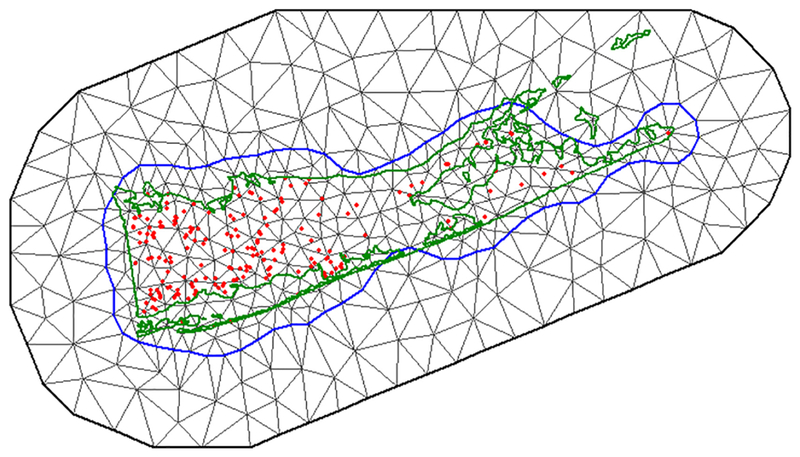
Fig. 1.

Triangulation mesh used to obtain the spatial covariance, with the political boundary of Suffolk County in green and observation points in red. The blue line represents the mesh boundary between the inner mesh, which contains the area to be modeled, and the outer mesh that is added on by the INLA mesh creator function to avoid boundary effects.
