Fig. 4.

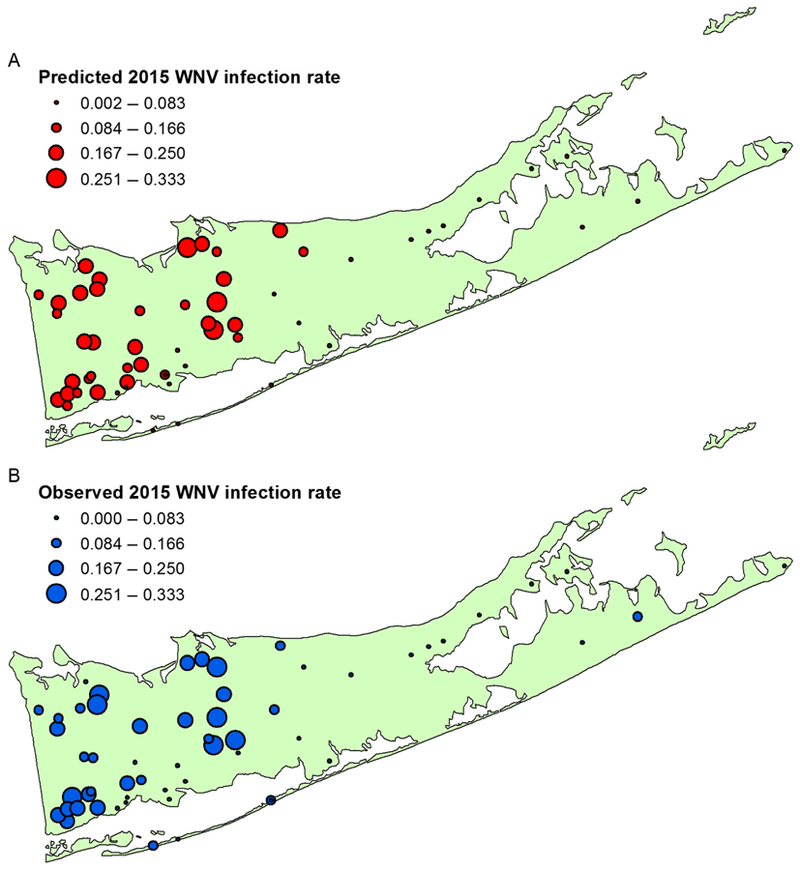
Predicted (A) and observed (B) West Nile virus (WNV) infection rates from traps in the 2015 holdout dataset. Rates listed reflect the mean annual frequency of a mosquito pool testing positive for WNV.

Predicted (A) and observed (B) West Nile virus (WNV) infection rates from traps in the 2015 holdout dataset. Rates listed reflect the mean annual frequency of a mosquito pool testing positive for WNV.