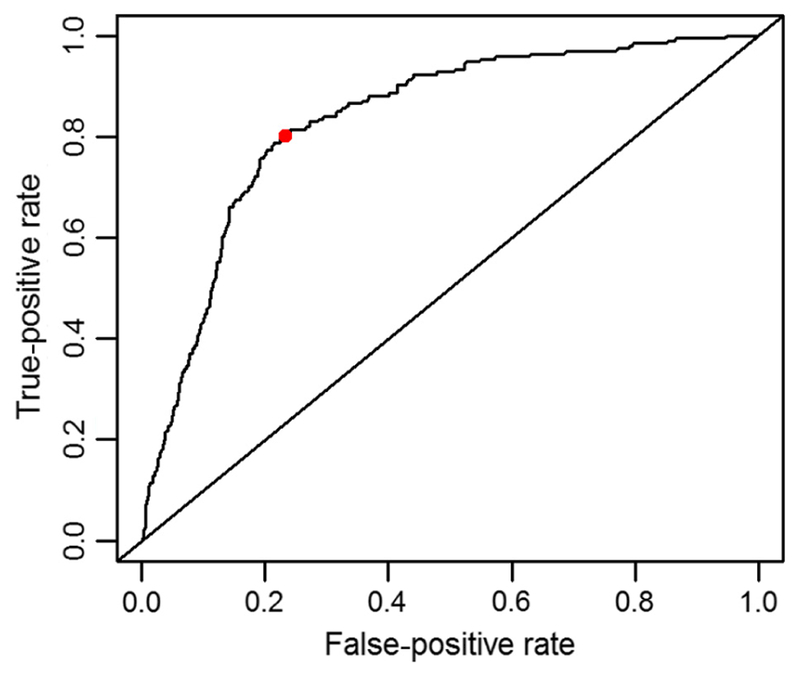
Fig. 5.

Receiver-operating characteristic curve for the final spatiotemporal model predicting 2015 West Nile virus incidence, illustrating the tradeoff between sensitivity and specificity at a variety of cutoff points. The optimal cutoff, illustrated with a dot, minimizes the distance between the curve and the upper left corner of the graph, which represents a 100% accuracy rate.
