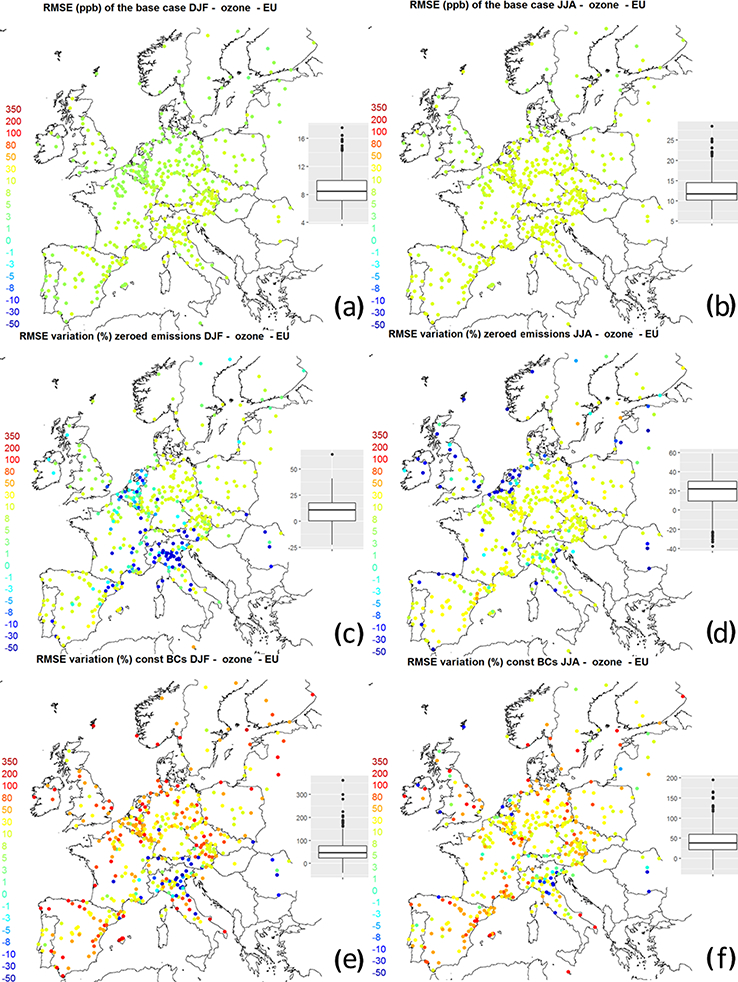
Figure 17.

(a, b) Spatial maps of RMSE (in ppb) for the base case. (c, d) Percentage RMSE changes for the zeroed emissions case with respect to the base case. (e, f) Percentage RMSE changes for the constant boundary condition case with respect to the base case. (a, c, e) Winter months (DJF); (b, d, f) summer months (JJA).
