
Figure 18.
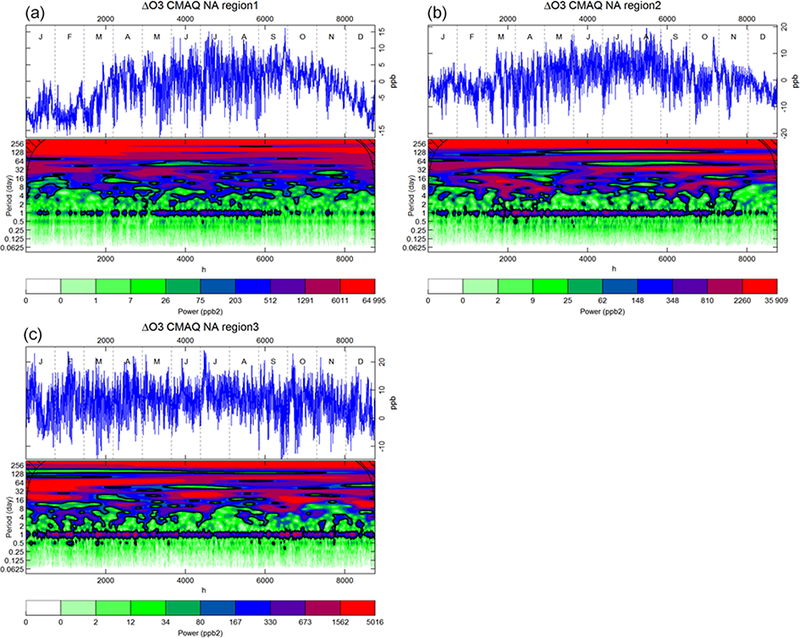
Annual time series of differences between CMAQ and observed O3 (ΔO3, top portion of each panel) and Morlet wavelet analysis of the periodogram of ΔO3 (lower portion of each panel) for the three NA subregions. Black contours lines identify the 95 % confidence interval. The period (in days) is reported in the vertical axis, while the quantiles of the power spectral density are measured in ppb2. (The scale reports the quantiles of the power spectrum.)