
Figure 27.
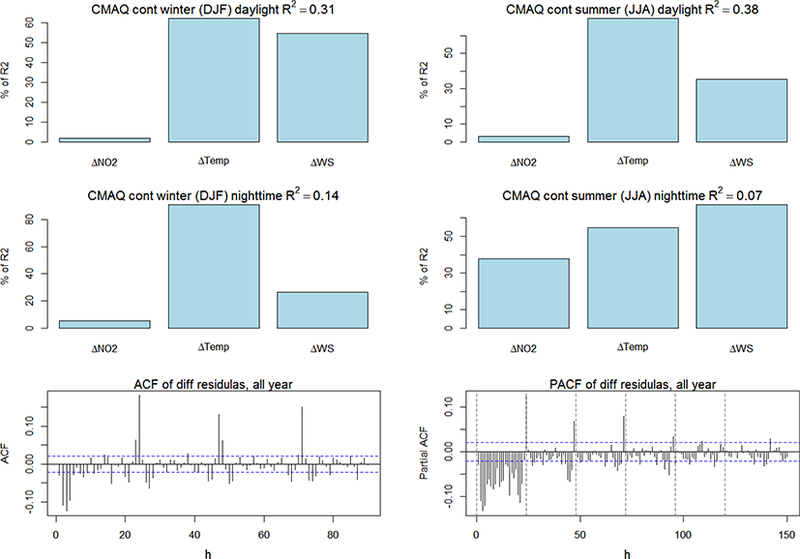
Percentage of variance explained by the regressors (the total R2 for the regression is reported in the title of each panel). The relative importance of each variable is assessed by using a bootstrap resampling. The plots at the bottom show the ACF and PACF of the yearly time series of residual of the fit, i.e. the portion of the ozone time series that was not captured by the linear regressions on the available variables. The analysis encompasses 47 co-located stations (the NA stations for ozone, NO2, WS, and Temp that fall in a radius of 1000 m and vertical displacement less than 250 m).