
Figure 6.
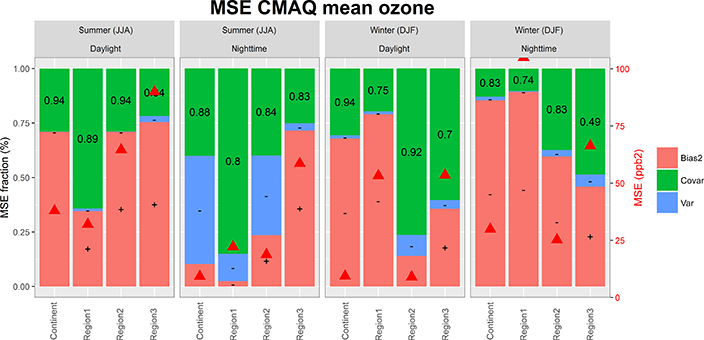
CMAQ MSE breakdown for summer and winter for the base case (hourly time series of ozone) over NA. The error coefficients Fb, Fv, and Fc are reported on the left axis and the total MSE (ppb2) on the right axis (red triangles). The + and — signs within the bias and variance portions of the errors indicate model over- and underprediction of mean concentration or variance, respectively. The values in the covariance portion indicate the correlation coefficient between modelled and observed time series. Results are provided separately for daytime and nighttime.