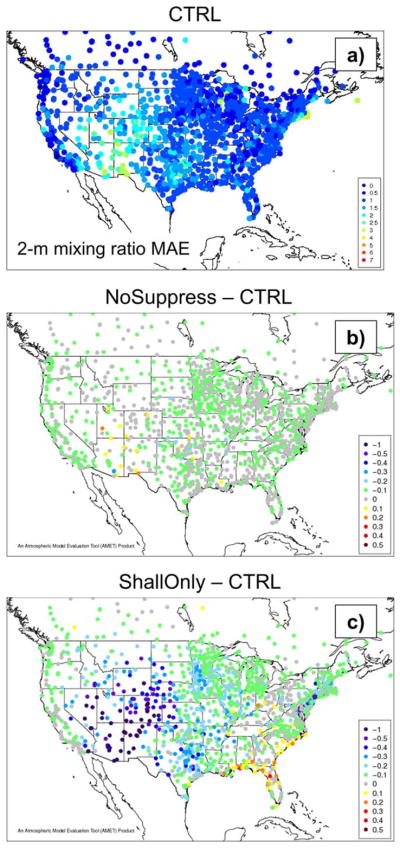
Figure 13.
(a) Spatially distributed 2 m water vapor mixing ratio MAE for CTRL averaged over July 2013. (b) Difference in 2 m mixing ratio MAE between NoSuppress and CTRL. (c) As in Figure 13b, but for ShallOnly. Each dot represents a MADIS observation site. In Figures 13b and 13c, cold colors (negative values) indicate a lower MAE than CTRL (i.e., better performance) and warm colors (positive values) indicate a higher MAE than CTRL (worse performance).

