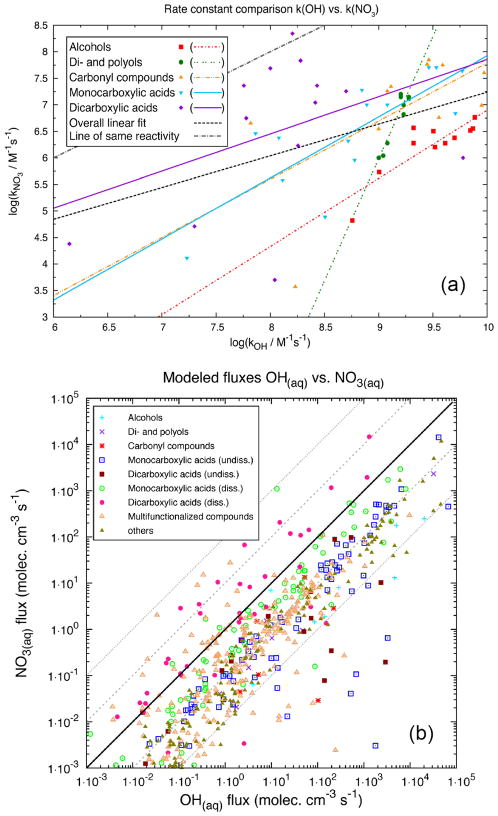
Figure 4.
(a) Correlation of OH versus NO3 radical rate constants in the aqueous phase for the respective compound classes. The linear regression fits for the different compound classes are presented in the same color as the respective data points. The black line represents the correlation of the overall data. (b) Comparison of modeled, aqueous-phase reaction fluxes (mean chemical fluxes in mol cm−3 s−1 over a simulation period of 4–5 days) of organic compounds with hydroxyl (OH) versus nitrate (NO3) radicals distinguished by different compound classes (urban CAPRAM summer scenario).

