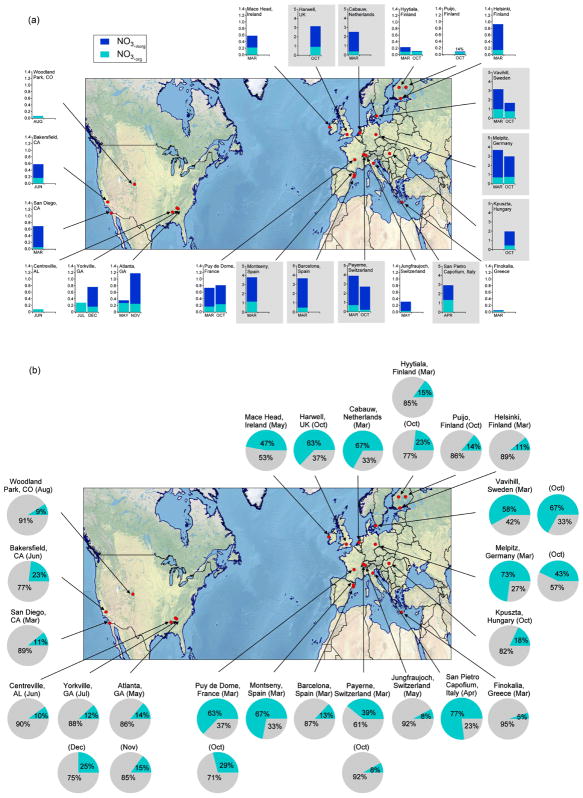
Figure 5.
(a) Average mass concentrations (in μg m−3, ambient temperature and pressure) of submicrometer particulate organic nitrates (NO3, org) and particulate inorganic nitrates (NO3, inorg) in different months at multiple sites. The concentrations correspond to mass concentrations of –ONO2 functionality. Note that the y axis is different for sites with total nitrates greater than 1 μg m−3 (shaded). Detailed information and measurements for each site are provided in Table S5. (b) Percentage (by mass; cyan) of submicrometer particulate organic nitrate aerosols in ambient organic aerosols in different months at multiple sites. Detailed information and measurements for each site are provided in Table S5.

