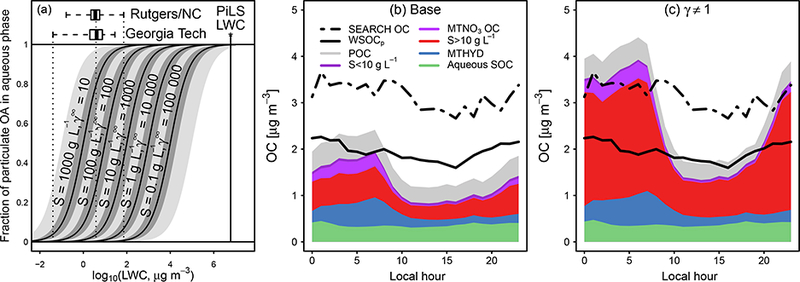
Figure 13.

Fraction of OA present in aqueous phase (a) as a function of activity coefficient at infinite dilution and observed OC and WSOCp at CTR compared to model predictions (b-c). Panel (a) boxplots indicate observed LWC from Rutgers/NC State (Nguyen et al., 2014b) and GeorgiaTech (Guo et al., 2015) during SOAS. Forpredictions (a), WIOAis 1 μg m−3 and the species molecularweightis set to 180gmol-1. Predictions in dark grey shading span a factor of 2 in WIOA (0.5 to 2μg m−3). Predictions in light grey shading (a) indicate a factor of 10 in WIOA (0.1 to 10μg m−3). Panel (b) corresponds to model predictions in the base simulation, while panel (c) corresponds to predictions in the γ ≠ 1 simulation. Model predictions of OC are stacked and divided into POC, compounds with (solubilities less than 10gL−1, Table 2), monoterpene nitrate OC, compounds with (solubilities greater than 10gL−1), the organic nitratehydrolysis product, and aqueous SOC.
