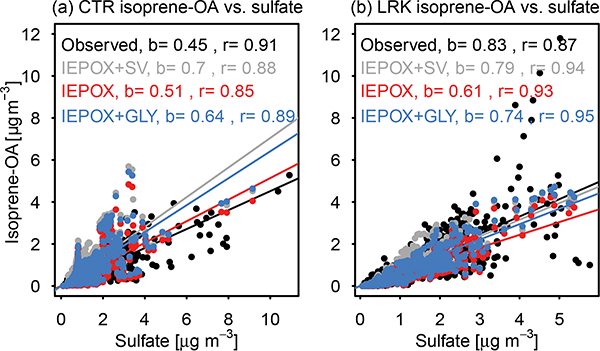
Figure 6.

Isoprene-OA vs. sulfate at (a) CTR and (b) LRK and the slope (b, forced through 0) and correlation coefficient (r) for each data set. Model representations of isoprene-OA include SOA from IEPOX uptake and semivolatile isoprene + OH SOA (IEPOX + SV). SOA from IEPOX uptake (IEPOX). and SOA from IEPOX and glyoxal uptake (IEPOX + GLY).
