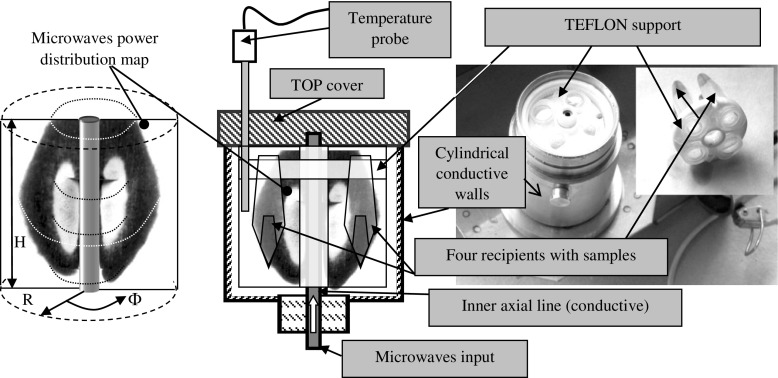
Fig. 3.
The coaxial treatment chamber. The sample location is correlated with the microwave power distribution inside the cavity (TEM101 mode - electric and magnetic field: one maxim upon radius R, constant over angle Φ one maxim over height H); the power distribution map shows the intensity of the radiation in the diametrical section of the cavity; the image suggests a toroidal distribution, where the white color is the highest intensity field and black is the lower intensity field (the area of gray tonalities depends on the thermographic transducer exposure time (120 s) (Surducan et al. 1997)

