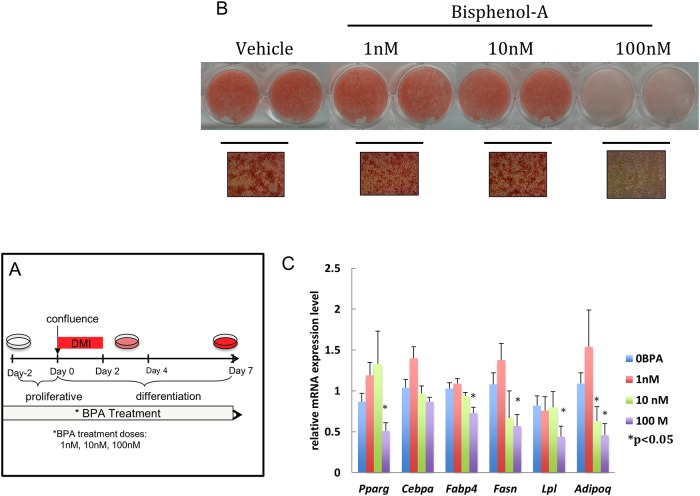
Fig 1. Effect of continuous BPA treatment on adipogenesis.
Confluent 3T3-L1 cells were exposed to different concentrations of BPA (1-100nM) or Vehicle (0.1% ethanol) from day -2 to day 7. Adipocyte differentiation was induced at day 0 with media enriched with dexamethasone, insulin and isobutylmethylxanthine (DMI). (A) Schematic representation of the treatment dose and time course applied. (B) Triglyceride accumulation was visualized by oil Red O staining and representative bright field microscopy images (40X magnification) were acquired between day 8–9. (C) Quantitative reverse transcription PCR (qRT-PCR) analysis of adipocyte marker gene expression was performed between day 8–9. Gene expression was normalized to 36B4 and is presented as relative mRNA expression level. *p<0.05 versus vehicle treated cells exposed to same protocol.

