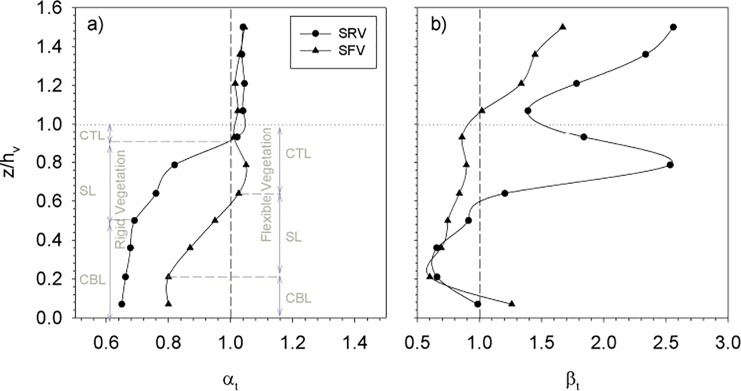
Fig 3.
a) αt profiles at y = 0 cm for the full vegetation case carried out at SPF = 10% for both rigid (SRV) and flexible (SFV) plants. b) βt profiles at y = 0 cm for the full vegetation case carried out at SPF = 10% for both rigid and flexible plants. Vertical dashed lines represent the ratio αt = βt = 1. Horizontal dotted lines represent plant height. The vertical axis is the non-dimensional height z/hv above the flume bed. Grey dashed lines represent the vertical layers occupied by the canopy. CTL = canopy top layer, SL = shear layer, CBL = canopy bottom layer.

