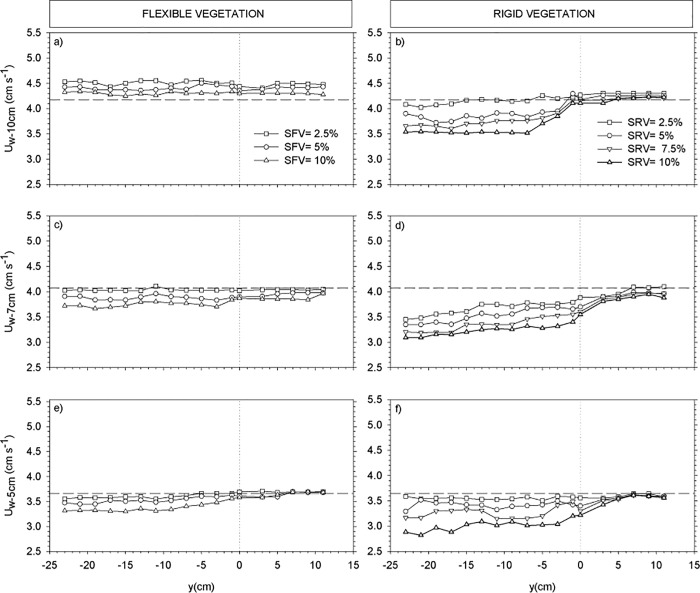
Fig 4.
Wave velocity transects across the width of the flume (y-axis) for: z = 10 cm for flexible (a) and rigid (b) canopy models, for z = 7 cm for flexible (c) and rigid (d) canopy models, and z = 5 cm for flexible (e) and rigid (f) canopy models. Horizontal dashed lines correspond to wave velocities for the experiment without plants. Vertical dotted lines correspond to the y-position of the edge of the vegetation. Negative y values correspond to the region covered with plants.

