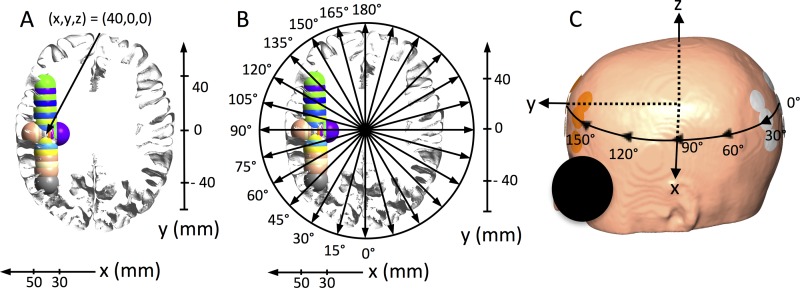
Fig 1. Visualization of coordinate system, tumor locations and electrode rotation.
A. Axial section in the xy-plane of the GM and WM surface of the head model with all tumor locations superimposed (radiological orientation). X- and y-axes are shown to illustrate tumor center coordinates in millimeters. The tumor position x = 40 mm, y = 0 mm, and z = 0 mm is indicated by a solid arrow. All tumors were located in the electrode plane, i.e. z = 0 mm and had the following x- and y-coordinates: X-translations (mm): (30, 0, 0), (32.5, 0, 0), (35, 0, 0), (37.5, 0, 0), (42.5, 0, 0), (45, 0, 0), (47.5, 0, 0), (50, 0, 0). Y-translations (mm): (40, -40, 0), (40, -30, 0), (40, -25, 0), (40, -20, 0), (40, -10, 0), (40, 5, 0), (40, 10, 0), (40, 15, 0), (40, 20, 0), (40, 25, 0), (40, 30, 0). B. Same section as shown in panel A, but with illustrations of the tested electrode rotations in the xy-plane from 0 to 180 degrees at 15-degree intervals. C. Surface view of the head model with one electrode array pair in the AP position, i.e. 0 degrees. The x-, y-, and z- axes are shown along with a schematic illustration of the rotations path of the electrode arrays on the skin.

